BlogHow-To Guides
What Is Debugging? A Practical Guide for Modern Software Teams

BridgeApp Team
10 min read

Every software developer has stared at a screen, wondering why their program is producing wrong results. The debugging process involves identifying and resolving code issues so that software functions correctly and efficiently. This guide walks you through what debugging actually means in practice, the errors it targets, the techniques that work, and how modern tools and AI are reshaping how teams fix bugs in software.
Key Takeaways
- Debugging is the systematic approach of finding and fixing coding errors-especially logical errors and runtime failures-so software behaves as intended.
- Debugging is different from testing: testing finds failures, while the debugging process investigates their root cause and corrects the underlying defect.
- Integrated development environments (IDEs) and standalone debugging tools (breakpoints, watch windows, stack traces, log viewers) make debugging code faster and more reliable.
- Common debugging techniques like divide and conquer, logging, debugger stepping, and rubber duck debugging help developers isolate issues in complex systems.
- Platforms like Magic Coder by BridgeApp can orchestrate automated debugging workflows across large codebases, making debugging easier at scale.
What Is Debugging?
Debugging is the engineering discipline of locating, understanding, and fixing defects in software or hardware so that actual behavior matches specified behavior. The term debugging traces back further than most people realize-Thomas Edison used "bug" to describe flaws in his devices in the late 19th century. The famous example came in 1947, when engineers found a moth lodged in the Harvard University Mark II relay computer and taped it into the logbook as "the first actual case of bug being found."
In practice, bugs can stem from:
- Syntax errors in source code (missing punctuation, incorrect keywords)
- Logic errors that produce incorrect code output despite valid syntax
- Configuration issues and integration faults between services and APIs
- Runtime errors triggered only under specific inputs or environmental conditions
Debugging includes steps like reproducing conditions, forming hypotheses, and fixing bugs through iterative cycles. In 2026, most debugging in software development focuses on logical errors and runtime errors in distributed systems-not just simple compilation failures. Developers often cycle through investigation, hypothesis, experimentation, and verification multiple times before fully resolving a tricky bug.
Why Debugging Matters in Real-World Software Projects
Unresolved coding errors in modern applications-web, mobile, embedded, cloud-native microservices-directly threaten reliability, security, and user experience. Outages, data corruption, payment failures, and inaccurate analytics are common consequences when bugs go unfixed.
Consider the scale of the problem: according to Lightrun's 2026 State of AI-Powered Engineering Report, 43% of AI-generated code changes still required manual debugging in production even after passing QA. CI/CD pipelines still produce defects that require debugging, regardless of how strong your testing suites are.
Why this matters for your team:
- Debugging reduces mean time to resolution (MTTR) for incidents, making it a core part of SRE and incident response practices.
- Fixing a bug during early development saves significant time and cost compared to post-release fixes.
- Clean, well-debugged code is easier to maintain, read, and update over time.
- Debugging can deepen developers' understanding of system logic and relationships between modules.
- Systematic debugging increases team confidence to ship frequently, refactor aggressively, and modernize legacy systems.
Types of Errors That Require Debugging
Understanding error categories helps you pick the right debugging techniques and software tools. Developers prioritize bugs based on their impact on functionality.
- Syntax errors occur from missing code elements like parentheses, commas, or semicolons. For example, a missing semicolon in C++ or incorrect indentation in Python. These are usually caught by compilers or interpreters before program execution, making them the easiest category to identify errors and resolve.
- Logical errors produce incorrect outputs despite correct syntax. The program runs, but delivers wrong results. A classic example: using > instead of >= in a boundary check, or miscalculating interest in a fintech application. These are among the hardest bugs to catch because no error occurs at compile time.
- Runtime errors happen during application execution or startup-null pointer dereferences, division by zero, out-of-memory conditions, or unhandled exceptions in programming languages like Java, C#, and JavaScript.
- Semantic errors violate coding language rules without producing meaningful output. For example, passing wrong units to an API or misinterpreting time zones and locales. The code compiles and runs, but the meaning is wrong.
- Multi-factor bugs: In production systems, many bugs combine logical errors with environment-specific runtime conditions-like configuration mismatches between staging and Kubernetes-based production.
The Debugging Process: From Bug Report to Root Cause
The debugging process typically involves a repeatable workflow rather than random trial-and-error. The debugging process can be labor-intensive and challenging, but structure makes it manageable. Debugging involves fixing bugs after they are reported.
- Reproduce the issue. Reproducing the issue involves recreating the exact conditions that trigger an error-capturing steps, inputs, environment details, and timestamps.
- Isolate the bug. Narrow down the problematic module, feature flag, commit range, or microservice endpoint. Isolating the root cause means tracing it back to a specific line of code or function.
- Analyze root cause. Read stack traces, inspect the program's state and variable values, and reason about control and data flow. Research on DDB, a source-level interactive debugger for distributed applications, achieved 100% fault localization success versus roughly 38.5% for baseline debugging tools.
- Implement and review the fix. The resolution stage involves modifying the code to fix the flaw without introducing new issues. Use version control (Git) and peer code review to avoid regressions. Write minimal, targeted changes.
- Validate. The verification stage tests modified code to ensure the bug is fixed without breaking existing functionality. Run targeted test cases, regression suites, and possibly canary releases.
- Document. Preventive measures after debugging include updating documentation and writing unit tests. Record the cause, fix, and lessons learned in issue trackers or internal runbooks. In mature teams, incident postmortems feed continuous improvement of coding and testing practices.
Common Debugging Techniques
Experienced software developers mix several strategies depending on error type, language, and runtime environment. Debugging encourages systematic thinking by fostering hypothesis formation and evidence gathering.
- Debugger stepping: Enter debug mode using step-into, step-over, and step-out to follow program execution code step by code step, inspecting variables and function calls at each line. This lets you pause execution and examine the program's state at the exact location of interest.
- Divide and conquer: Divide and conquer segments code for easier bug identification. Use feature toggles, git-bisect, or targeted tests to narrow where the failure originates in large computer programs.
- Backtracking and cause elimination: Backtracking helps identify errors by retracing program steps from the observed failure backward through code paths, testing hypotheses one by one until the root cause emerges.
- Print and log debugging: Add print statements or structured log files (JSON with correlation IDs) to trace program flow in concurrent or distributed systems. Still one of the most common debugging techniques across scripting languages and compiled languages alike.
- Rubber duck debugging: Rubber duck debugging involves explaining code to an inanimate object-a colleague, a rubber duck, or an AI assistant-to surface hidden logical errors and incorrect assumptions.
- Incremental development: Incremental development allows frequent testing of small code portions. Writing and testing small programs or features in small increments keeps bugs localized and debugging easier.
Debugging Tools and Integrated Development Environments (IDEs)
Modern debugging relies heavily on integrated development environments IDEs and specialized debugging tools rather than manual inspection of source code alone. Developers use integrated development environments for step-by-step code inspection.
- IDE-based debuggers: Visual Studio, IntelliJ IDEA, Eclipse, PyCharm, Android Studio, and Visual Studio Code all offer built-in debugging tools-breakpoints, watch windows, call stacks, variable inspection, and conditional breakpoints. These make it straightforward to set a breakpoint at any code line, inspect line numbers, and watch how variables change during program execution.
- Standalone debuggers: The GNU Debugger (GDB) for C/C++, LLDB for LLVM-based toolchains, Python Debugger (PDB), Node.js Inspector, and browser devtools for web frontends. Standalone debuggers like GDB provide advanced debugging features including remote debugging features, reverse execution, and hardware breakpoint support across operating systems.
- Logging and observability: Logging utilities help analyze a program's state at various points. Tools like Elastic Stack, Grafana, Prometheus, and cloud vendor log services help teams analyze massive log volumes and distributed traces for production debugging.
- Static code analysis tools: Static code analyzers detect potential errors without running code-scanning source code for bugs, security issues, and style violations. Examples include SonarQube, ESLint, and Pylint.
- Dynamic analysis and profilers: Dynamic analysis tools monitor software during execution to find issues like memory leaks, race conditions, and CPU bottlenecks. These often surface subtle logical errors or runtime failures invisible to static analysis.
- AI-powered assistants: Integrated development environments increasingly embed AI-powered debugging assistants that can suggest bug fixes, explain stack traces, and generate targeted tests. IBM notes that current LLMs remain weaker on logic errors than on syntax or reference errors-an important limitation for computer programmers relying on generative AI.
Debugging in Modern Environments: Cloud, Remote, and Embedded Systems
As of 2026, debugging often happens far from a single developer's laptop. Cloud-native applications, remote servers, containers, and embedded devices each bring distinct challenges.
- Remote debugging: Connect local tools to processes running on remote servers, Kubernetes pods, or cloud instances using port-forwarding, secure tunnels, and remote debug adapters. Many IDEs support remote debugging features natively.
- Cloud debugging challenges: Configuration drift between local and production environments causes bugs that only manifest at scale. Distributed traces across microservices, massive log volumes, and ephemeral containers require specialized debugging tools and observability platforms.
- Embedded systems: Different CPU architectures, vendors, and RTOSes demand hardware-specific tools-JTAG-based probes, On-Chip Debug Modules, and vendor IDEs. Resources like memory and CPU are constrained, and standard debugging workflows from computer science textbooks may not apply directly.
- Anti-debugging techniques: Certain software-including malware and DRM-protected binaries-intentionally detects and obstructs debuggers, complicating the debugging process for security analysts and making fault localization significantly harder.
- Reproducibility matters: In all these environments, high-quality telemetry (logs, metrics, traces) is key to locating the root cause of elusive bugs. Without reproducibility, even the best debugging skills fall short.
Debugging vs. Testing
Testing and debugging are complementary but distinct activities in the software development lifecycle.
- Testing (unit, integration, system, end-to-end) exercises computer programs with defined test cases to detect failures. Testing identifies bugs but does not explain their causes.
- Debugging corrects issues found during testing. It begins after a failure is observed-when an error occurs, developers investigate logs, traces, and code paths to determine root cause and implement a fix.
- QA testers typically perform testing, while developers handle debugging. In small teams, one person may do both.
- Good test coverage-especially unit tests and regression suites-makes debugging easier by narrowing the search area and preventing reintroduction of old bugs.
- Debugging is not only code correction: it involves understanding system behavior, validating assumptions, and often improving design, documentation, or monitoring. It builds debugging skills that make entire teams more effective over time.
How AI and Automation Are Changing the Debugging Process
AI-assisted coding and automated agents are starting to handle repetitive aspects of debugging. Automated debugging uses AI to identify errors quickly across massive codebases-a task that would be extremely time consuming for humans alone.
- Automated fault localization: Tools use static analysis, dynamic tracing, and machine learning to propose fixes, bisect failing commits, or generate minimal reproducible examples.
- AI-enhanced common debugging techniques: Automatic log analysis, anomaly detection in metrics, and summarization of long stack traces help developers identify the exact location of problems faster.
- Autonomous agents: Agents can execute structured debugging playbooks-reproducing issues, running targeted tests, inspecting relevant source code, and drafting patch suggestions that improve application performance.
- Human oversight remains essential: Engineers still review AI-generated patches, reason about trade-offs, and ensure long-term maintainability and security. AI has reduced coding time but introduced new stability risks, making human judgment irreplaceable.
How Magic Coder by BridgeApp Makes Debugging Easier
The gap in most AI debugging workflows is context. Tools that lack awareness of your architecture, task history, and coding standards produce plausible-looking but incorrect code-patches that create new bugs. Magic Coder by BridgeApp addresses this directly.
- Magic Coder operates as a set of coordinated agents (architect, developer, reviewer, QA) that can read your repositories, understand architecture, and assist in debugging code across services.
- It uses codebase intelligence to build a queryable graph of functions, modules, and services-making it straightforward to trace call chains and locate the true root cause instead of patching symptoms.
- Teams can configure flows where Magic Coder automatically reacts to failing tests or production alerts: reproduces the issue, inspects relevant code, proposes a fix, and opens a pull request for human review.
- Governance and safety are built in: all debugging actions run in isolated environments with audited access. Agents never merge changes themselves-the pipeline stops at "Waiting for Merge," preserving a human-in-the-loop guardrail.
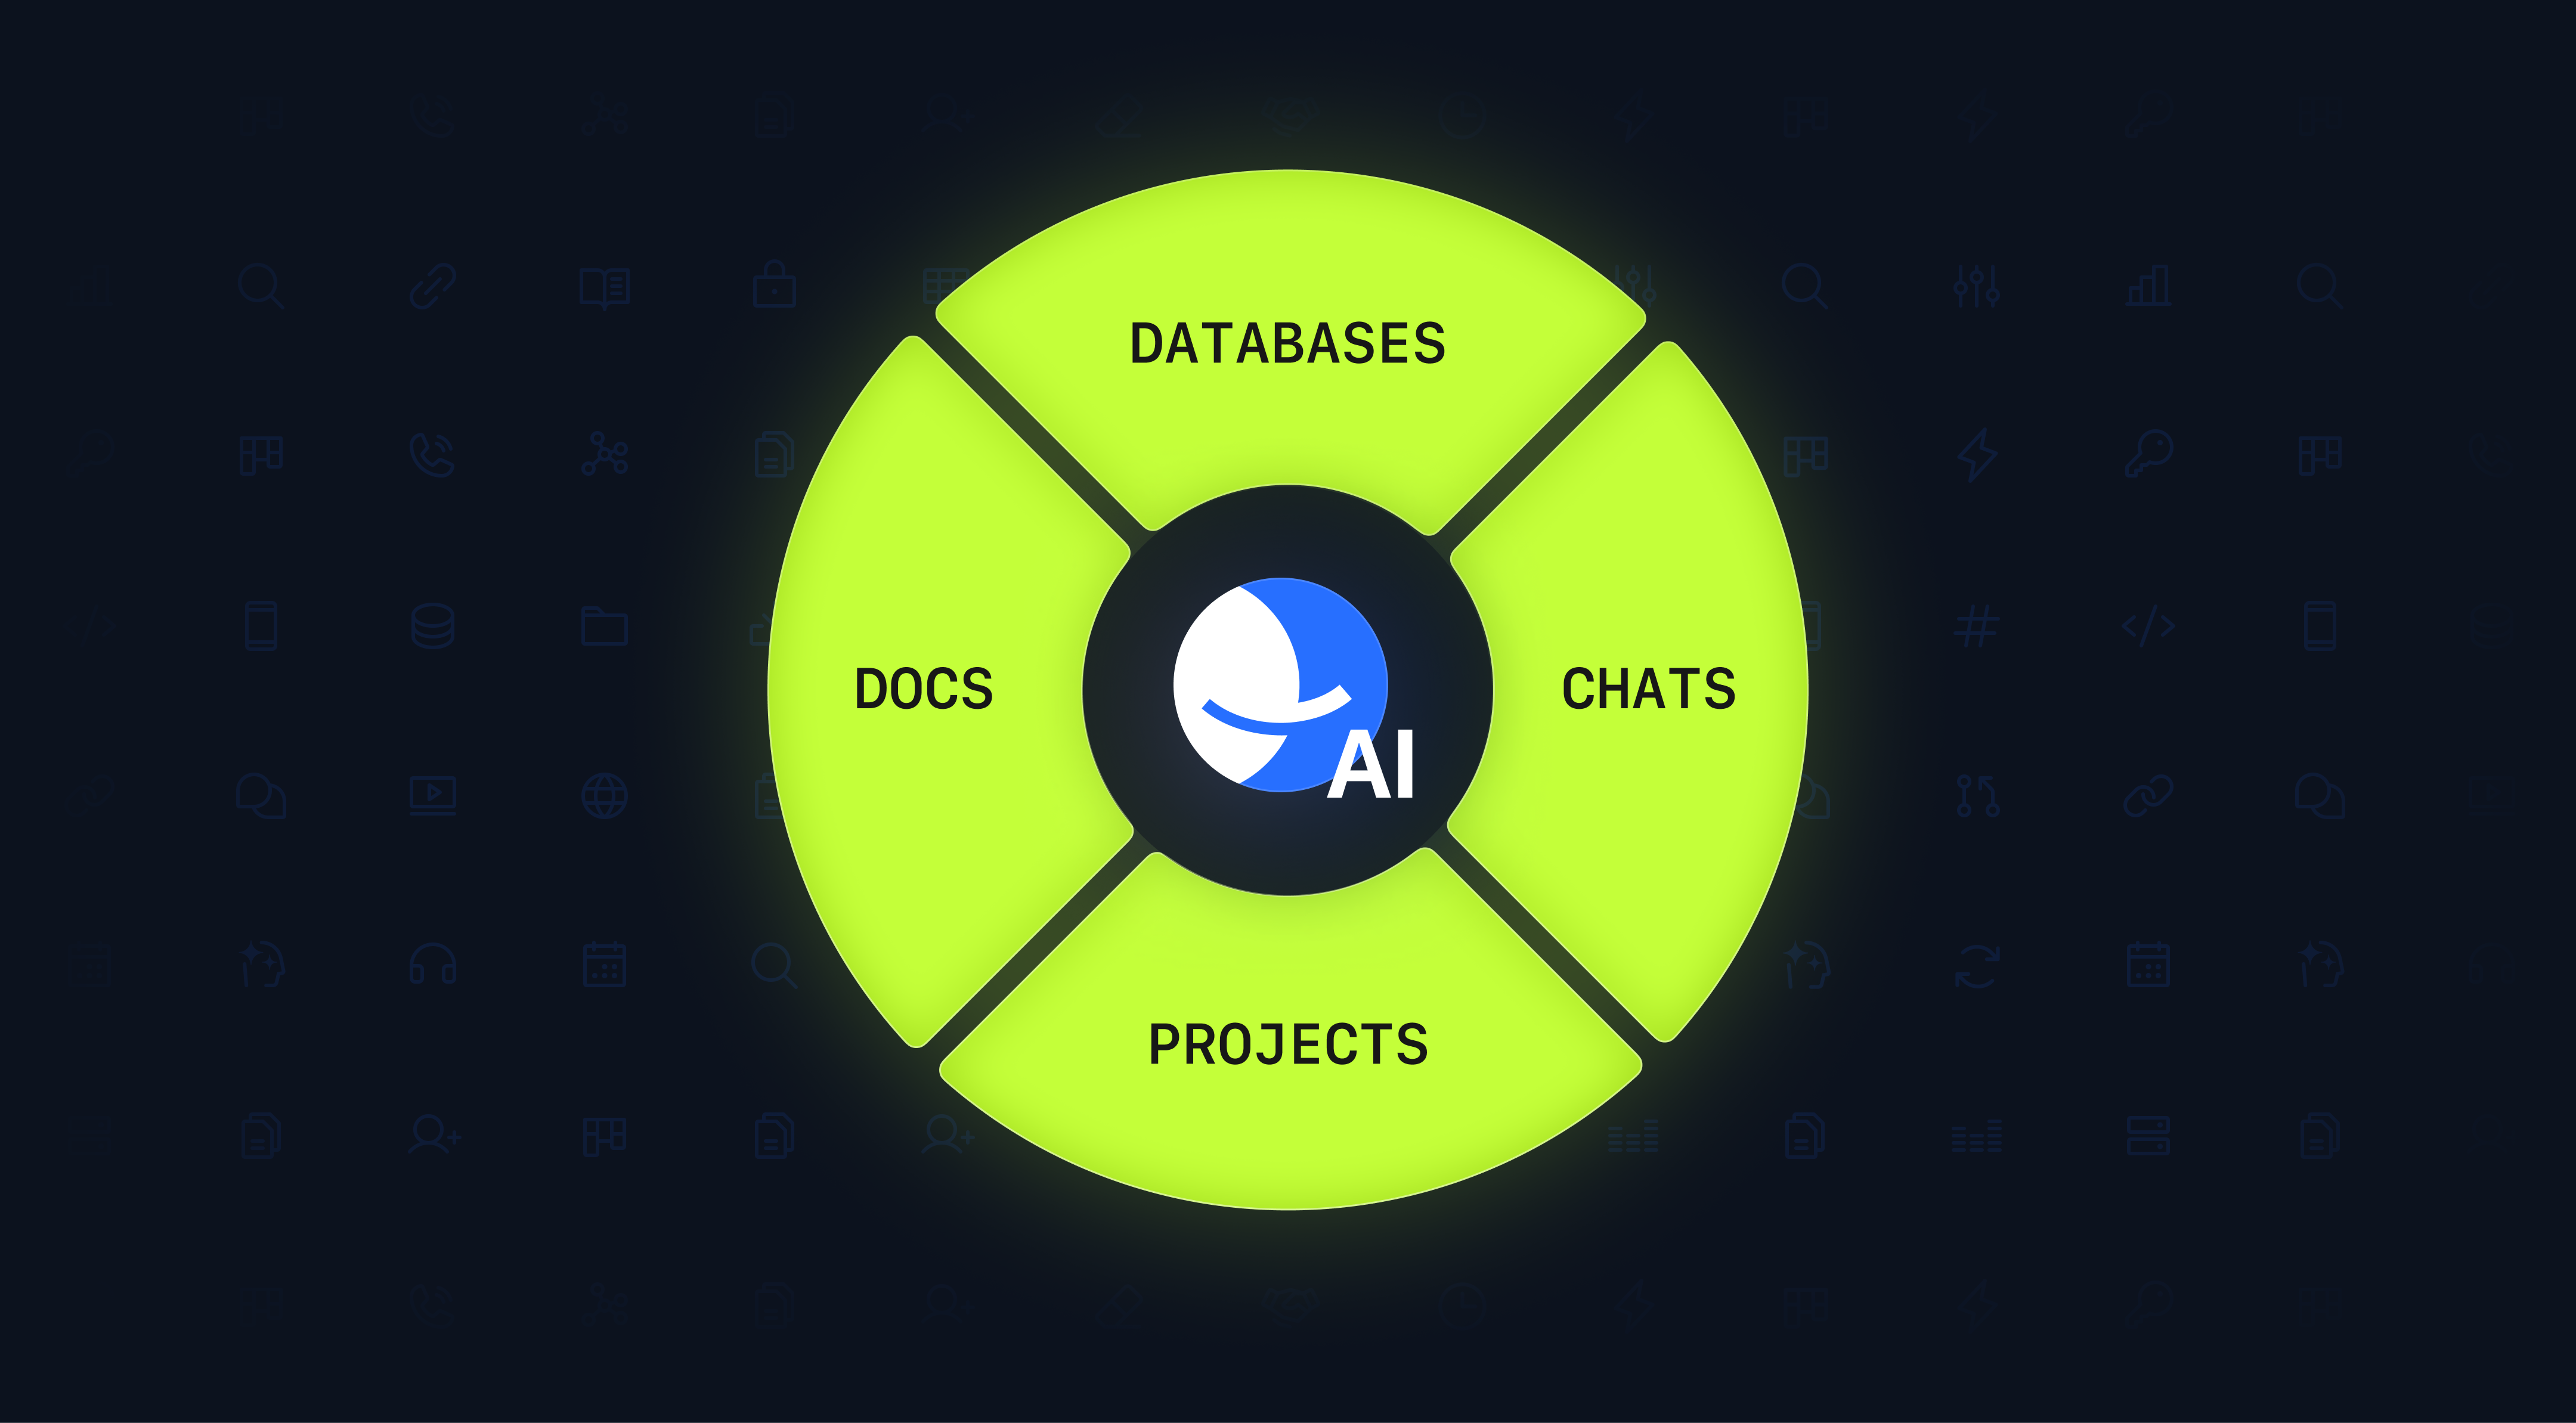
- Because BridgeApp combines Projects, Documents, and Magic Coder in one workspace, debugging conversations, design notes, and code changes stay linked to the original incident or task-eliminating the context loss that plagues teams using disconnected tools.
FAQ
Is debugging only about fixing logical errors?
While logical errors are a major focus, debugging also targets runtime errors, configuration issues, integration mismatches, and environment-specific problems such as missing permissions or resource limits. In distributed systems, many bugs span multiple error categories simultaneously.
How early in a project should I think about debugging?
Day one. Adopt clear logging practices, consistent error handling, and unit tests from the start. When bugs appear later, they will be far easier to reproduce and diagnose if you have solid instrumentation and well-structured code in place.
Do small personal projects really need debugging tools and IDEs?
Yes. Even small scripts benefit from basic built-in debugging tools-simple breakpoints, watch windows, and log statements can save hours. Modern lightweight IDEs like Visual Studio Code make this almost effortless, even for small programs or query languages.
Can AI completely automate the debugging process?
As of 2026, AI can accelerate many parts of the debugging process-log analysis, candidate bug fixes, test generation-but cannot safely replace human judgment in reviewing changes, understanding domain rules, and making architectural decisions about incorrect code.
What skills should developers build to become better at debugging?
Strengthen fundamentals in computer science topics like data structures and algorithms, learn how integrated development environments and debugging tools work across multiple programming languages, practice systematic root cause analysis, and study postmortems or bug reports from seasoned teams. These habits build lasting debugging skills.